12. Cost Control, Monitoring and Accounting12.1 The Cost Control ProblemDuring the execution of a project, procedures for project control and record keeping become indispensable tools to managers and other participants in the construction process. These tools serve the dual purpose of recording the financial transactions that occur as well as giving managers an indication of the progress and problems associated with a project. The problems of project control are aptly summed up in an old definition of a project as "any collection of vaguely related activities that are ninety percent complete, over budget and late." [1] The task of project control systems is to give a fair indication of the existence and the extent of such problems. In this chapter, we consider the problems associated with resource utilization, accounting, monitoring and control during a project. In this discussion, we emphasize the project management uses of accounting information. Interpretation of project accounts is generally not straightforward until a project is completed, and then it is too late to influence project management. Even after completion of a project, the accounting results may be confusing. Hence, managers need to know how to interpret accounting information for the purpose of project management. In the process of considering management problems, however, we shall discuss some of the common accounting systems and conventions, although our purpose is not to provide a comprehensive survey of accounting procedures. The limited objective of project control deserves emphasis. Project control procedures are primarily intended to identify deviations from the project plan rather than to suggest possible areas for cost savings. This characteristic reflects the advanced stage at which project control becomes important. The time at which major cost savings can be achieved is during planning and design for the project. During the actual construction, changes are likely to delay the project and lead to inordinate cost increases. As a result, the focus of project control is on fulfilling the original design plans or indicating deviations from these plans, rather than on searching for significant improvements and cost savings. It is only when a rescue operation is required that major changes will normally occur in the construction plan. Finally, the issues associated with integration of information will require some discussion. Project management activities and functional concerns are intimately linked, yet the techniques used in many instances do not facilitate comprehensive or integrated consideration of project activities. For example, schedule information and cost accounts are usually kept separately. As a result, project managers themselves must synthesize a comprehensive view from the different reports on the project plus their own field observations. In particular, managers are often forced to infer the cost impacts of schedule changes, rather than being provided with aids for this process. Communication or integration of various types of information can serve a number of useful purposes, although it does require special attention in the establishment of project control procedures. Back to top12.2 The Project BudgetFor cost control on a project, the construction plan and the associated cash flow estimates can provide the baseline reference for subsequent project monitoring and control. For schedules, progress on individual activities and the achievement of milestone completions can be compared with the project schedule to monitor the progress of activities. Contract and job specifications provide the criteria by which to assess and assure the required quality of construction. The final or detailed cost estimate provides a baseline for the assessment of financial performance during the project. To the extent that costs are within the detailed cost estimate, then the project is thought to be under financial control. Overruns in particular cost categories signal the possibility of problems and give an indication of exactly what problems are being encountered. Expense oriented construction planning and control focuses upon the categories included in the final cost estimation. This focus is particular relevant for projects with few activities and considerable repetition such as grading and paving roadways. For control and monitoring purposes, the original detailed cost estimate is typically converted to a project budget, and the project budget is used subsequently as a guide for management. Specific items in the detailed cost estimate become job cost elements. Expenses incurred during the course of a project are recorded in specific job cost accounts to be compared with the original cost estimates in each category. Thus, individual job cost accounts generally represent the basic unit for cost control. Alternatively, job cost accounts may be disaggregated or divided into work elements which are related both to particular scheduled activities and to particular cost accounts. Work element divisions will be described in Section 12.8. In addition to cost amounts, information on material quantities and labor inputs within each job account is also typically retained in the project budget. With this information, actual materials usage and labor employed can be compared to the expected requirements. As a result, cost overruns or savings on particular items can be identified as due to changes in unit prices, labor productivity or in the amount of material consumed. The number of cost accounts associated with a particular project can vary considerably. For constructors, on the order of four hundred separate cost accounts might be used on a small project. [2] These accounts record all the transactions associated with a project. Thus, separate accounts might exist for different types of materials, equipment use, payroll, project office, etc. Both physical and non-physical resources are represented, including overhead items such as computer use or interest charges. Table 12-1 summarizes a typical set of cost accounts that might be used in building construction. [3] Note that this set of accounts is organized hierarchically, with seven major divisions (accounts 201 to 207) and numerous sub-divisions under each division. This hierarchical structure facilitates aggregation of costs into pre-defined categories; for example, costs associated with the superstructure (account 204) would be the sum of the underlying subdivisions (ie. 204.1, 204.2, etc.) or finer levels of detail (204.61, 204.62, etc.). The sub-division accounts in Table 12-1 could be further divided into personnel, material and other resource costs for the purpose of financial accounting, as described in Section 12.4.
In developing or implementing a system of cost accounts, an appropriate numbering or coding system is essential to facilitate communication of information and proper aggregation of cost information. Particular cost accounts are used to indicate the expenditures associated with specific projects and to indicate the expenditures on particular items throughout an organization. These are examples of different perspectives on the same information, in which the same information may be summarized in different ways for specific purposes. Thus, more than one aggregation of the cost information and more than one application program can use a particular cost account. Separate identifiers of the type of cost account and the specific project must be provided for project cost accounts or for financial transactions. As a result, a standard set of cost codes such as the MASTERFORMAT codes described in Chapter 9 may be adopted to identify cost accounts along with project identifiers and extensions to indicate organization or job specific needs. Similarly the use of databases or, at a minimum, inter-communicating applications programs facilitate access to cost information, as described in Chapter 14. Converting a final cost estimate into a project budget compatible with an organization's cost accounts is not always a straightforward task. As described in Chapter 5, cost estimates are generally disaggregated into appropriate functional or resource based project categories. For example, labor and material quantities might be included for each of several physical components of a project. For cost accounting purposes, labor and material quantities are aggregated by type no matter for which physical component they are employed. For example, particular types of workers or materials might be used on numerous different physical components of a facility. Moreover, the categories of cost accounts established within an organization may bear little resemblance to the quantities included in a final cost estimate. This is particularly true when final cost estimates are prepared in accordance with an external reporting requirement rather than in view of the existing cost accounts within an organization. One particular problem in forming a project budget in terms of cost accounts is the treatment of contingency amounts. These allowances are included in project cost estimates to accommodate unforeseen events and the resulting costs. However, in advance of project completion, the source of contingency expenses is not known. Realistically, a budget accounting item for contingency allowance should be established whenever a contingency amount was included in the final cost estimate. A second problem in forming a project budget is the treatment of inflation. Typically, final cost estimates are formed in terms of real dollars and an item reflecting inflation costs is added on as a percentage or lump sum. This inflation allowance would then be allocated to individual cost items in relation to the actual expected inflation over the period for which costs will be incurred. Example 12-1: Project Budget for a Design Office An example of a small project budget is shown in Table 12-2. This budget might be used by a design firm for a specific design project. While this budget might represent all the work for this firm on the project, numerous other organizations would be involved with their own budgets. In Table 12-2, a summary budget is shown as well as a detailed listing of costs for individuals in the Engineering Division. For the purpose of consistency with cost accounts and managerial control, labor costs are aggregated into three groups: the engineering, architectural and environmental divisions. The detailed budget shown in Table 12-2 applies only to the engineering division labor; other detailed budgets amounts for categories such as supplies and the other work divisions would also be prepared. Note that the salary costs associated with individuals are aggregated to obtain the total labor costs in the engineering group for the project. To perform this aggregation, some means of identifying individuals within organizational groups is required. Accompanying a budget of this nature, some estimate of the actual man-hours of labor required by project task would also be prepared. Finally, this budget might be used for internal purposes alone. In submitting financial bills and reports to the client, overhead and contingency amounts might be combined with the direct labor costs to establish an aggregate billing rate per hour. In this case, the overhead, contingency and profit would represent allocated costs based on the direct labor costs.
Example 12-2: Project Budget for a Constructor Table 12-3 illustrates a summary budget for a constructor. This budget is developed from a project to construct a wharf. As with the example design office budget above, costs are divided into direct and indirect expenses. Within direct costs, expenses are divided into material, subcontract, temporary work and machinery costs. This budget indicates aggregate amounts for the various categories. Cost details associated with particular cost accounts would supplement and support the aggregate budget shown in Table 12-3. A profit and a contingency amount might be added to the basic budget of $1,715,147 shown in Table 12-3 for completeness.
Back to top 12.3 Forecasting for Activity Cost ControlFor the purpose of project management and control, it is not sufficient to consider only the past record of costs and revenues incurred in a project. Good managers should focus upon future revenues, future costs and technical problems. For this purpose, traditional financial accounting schemes are not adequate to reflect the dynamic nature of a project. Accounts typically focus on recording routine costs and past expenditures associated with activities. [4] Generally, past expenditures represent sunk costs that cannot be altered in the future and may or may not be relevant in the future. For example, after the completion of some activity, it may be discovered that some quality flaw renders the work useless. Unfortunately, the resources expended on the flawed construction will generally be sunk and cannot be recovered for re-construction (although it may be possible to change the burden of who pays for these resources by financial withholding or charges; owners will typically attempt to have constructors or designers pay for changes due to quality flaws). Since financial accounts are historical in nature, some means of forecasting or projecting the future course of a project is essential for management control. In this section, some methods for cost control and simple forecasts are described. An example of forecasting used to assess the project status is shown in Table 12-4. In this example, costs are reported in five categories, representing the sum of all the various cost accounts associated with each category:
The current status of the project is a forecast budget overrun of $5,950. with 23 percent of the budgeted project costs incurred to date.
For project control, managers would focus particular attention on items indicating substantial deviation from budgeted amounts. In particular, the cost overruns in the labor and in the "other expense category would be worthy of attention by a project manager in Table 12-4. A next step would be to look in greater detail at the various components of these categories. Overruns in cost might be due to lower than expected productivity, higher than expected wage rates, higher than expected material costs, or other factors. Even further, low productivity might be caused by inadequate training, lack of required resources such as equipment or tools, or inordinate amounts of re-work to correct quality problems. Review of a job status report is only the first step in project control. The job status report illustrated in Table 12-4 employs explicit estimates of ultimate cost in each category of expense. These estimates are used to identify the actual progress and status of a expense category. Estimates might be made from simple linear extrapolations of the productivity or cost of the work to date on each project item. Algebraically, a linear estimation formula is generally one of two forms. Using a linear extrapolation of costs, the forecast total cost, Cf , is:
where Ct is the cost incurred to time t and pt is the proportion of the activity completed at time t. For example, an activity which is 50 percent complete with a cost of $40,000 would be estimated to have a total cost of $40,000/0.5 = $80,000. More elaborate methods of forecasting costs would disaggregate costs into different categories, with the total cost the sum of the forecast costs in each category. Alternatively, the use of measured unit cost amounts can be used for forecasting total cost. The basic formula for forecasting cost from unit costs is:
where Cf is the forecast total cost, W is the total units of work, and ct is the average cost per unit of work experienced up to time t. If the average unit cost is $50 per unit of work on a particular activity and 1,600 units of work exist, then the expected cost is (1,600)(50) = $80,000 for completion. The unit cost in Equation (12.2) may be replaced with the hourly productivity and the unit cost per hour (or other appropriate time period), resulting in the equation:
where the cost per work unit (ct) is replaced by the time per unit, ht, divided by the cost per unit of time, ut. More elaborate forecasting systems might recognize peculiar problems associated with work on particular items and modify these simple proportional cost estimates. For example, if productivity is improving as workers and managers become more familiar with the project activities, the estimate of total costs for an item might be revised downward. In this case, the estimating equation would become:
where forecast total cost, Cf, is the sum of cost incurred to date, Ct, and the cost resulting from the remaining work (W - Wt) multiplied by the expected cost per unit time period for the remainder of the activity, ct. As a numerical example, suppose that the average unit cost has been $50 per unit of work, but the most recent figure during a project is $45 per unit of work. If the project manager was assured that the improved productivity could be maintained for the remainder of the project (consisting of 800 units of work out of a total of 1600 units of work), the cost estimate would be (50)(800) + (45)(800) = $76,000 for completion of the activity. Note that this forecast uses the actual average productivity achieved on the first 800 units and uses a forecast of productivity for the remaining work. Historical changes in productivity might also be used to represent this type of non-linear changes in work productivity on particular activities over time. In addition to changes in productivities, other components of the estimating formula can be adjusted or more detailed estimates substituted. For example, the change in unit prices due to new labor contracts or material supplier's prices might be reflected in estimating future expenditures. In essence, the same problems encountered in preparing the detailed cost estimate are faced in the process of preparing exposure estimates, although the number and extent of uncertainties in the project environment decline as work progresses. The only exception to this rule is the danger of quality problems in completed work which would require re-construction. Each of the estimating methods described above require current information on the state of work accomplishment for particular activities. There are several possible methods to develop such estimates, including [5]:
Systematic application of these different estimating methods to the various project activities enables calculation of the percentage complete or the productivity estimates used in preparing job status reports. In some cases, automated data acquisition for work accomplishments might be instituted. For example, transponders might be moved to the new work limits after each day's activity and the new locations automatically computed and compared with project plans. These measurements of actual progress should be stored in a central database and then processed for updating the project schedule. The use of database management systems in this fashion is described in Chapter 14. Example 12-3: Estimated Total Cost to Complete an Activity Suppose that we wish to estimate the total cost to complete piping construction activities on a project. The piping construction involves 1,000 linear feet of piping which has been divided into 50 sections for management convenience. At this time, 400 linear feet of piping has been installed at a cost of $40,000 and 500 man-hours of labor. The original budget estimate was $90,000 with a productivity of one foot per man-hour, a unit cost of $60 per man hour and a total material cost of $ 30,000. Firm commitments of material delivery for the $30,000 estimated cost have been received. Example 12-4: Estimated Total Cost for Completion The forecasting procedures described above assumed linear extrapolations of future costs, based either on the complete experience on the activity or the recent experience. For activities with good historical records, it can be the case that a typically non-linear profile of cost expenditures and completion proportions can be estimated. Figure 12-1 illustrates one possible non-linear relationships derived from experience in some particular activity. The progress on a new job can be compared to this historical record. For example, point A in Figure 12-1 suggests a higher expenditure than is normal for the completion proportion. This point represents 40% of work completed with an expenditure of 60% of the budget. Since the historical record suggests only 50% of the budget should be expended at time of 40% completion, a 60 - 50 = 10% overrun in cost is expected even if work efficiency can be increased to historical averages. If comparable cost overruns continue to accumulate, then the cost-to-complete will be even higher. 
Figure 12-1 Illustration of Proportion Completion versus Expenditure for an Activity Back to top 12.4 Financial Accounting Systems and Cost AccountsThe cost accounts described in the previous sections provide only one of the various components in a financial accounting system. Before further discussing the use of cost accounts in project control, the relationship of project and financial accounting deserves mention. Accounting information is generally used for three distinct purposes:
External reports are constrained to particular forms and procedures by contractual reporting requirements or by generally accepted accounting practices. Preparation of such external reports is referred to as financial accounting. In contrast, cost or managerial accounting is intended to aid internal managers in their responsibilities of planning, monitoring and control. Project costs are always included in the system of financial accounts associated with an organization. At the heart of this system, all expense transactions are recorded in a general ledger. The general ledger of accounts forms the basis for management reports on particular projects as well as the financial accounts for an entire organization. Other components of a financial accounting system include:
In traditional bookkeeping systems, day to day transactions are first recorded in journals. With double-entry bookkeeping, each transaction is recorded as both a debit and a credit to particular accounts in the ledger. For example, payment of a supplier's bill represents a debit or increase to a project cost account and a credit or reduction to the company's cash account. Periodically, the transaction information is summarized and transferred to ledger accounts. This process is called posting, and may be done instantaneously or daily in computerized systems. In reviewing accounting information, the concepts of flows and stocks should be kept in mind. Daily transactions typically reflect flows of dollar amounts entering or leaving the organization. Similarly, use or receipt of particular materials represent flows from or to inventory. An account balance represents the stock or cumulative amount of funds resulting from these daily flows. Information on both flows and stocks are needed to give an accurate view of an organization's state. In addition, forecasts of future changes are needed for effective management. Information from the general ledger is assembled for the organization's financial reports, including balance sheets and income statements for each period. These reports are the basic products of the financial accounting process and are often used to assess the performance of an organization. Table12-5 shows a typical income statement for a small construction firm, indicating a net profit of $ 330,000 after taxes. This statement summarizes the flows of transactions within a year. Table 12-6 shows the comparable balance sheet, indicated a net increase in retained earnings equal to the net profit. The balance sheet reflects the effects of income flows during the year on the overall worth of the organization.
In the context of private construction firms, particular problems arise in the treatment of uncompleted contracts in financial reports. Under the "completed-contract" method, income is only reported for completed projects. Work on projects underway is only reported on the balance sheet, representing an asset if contract billings exceed costs or a liability if costs exceed billings. When a project is completed, the total net profit (or loss) is reported in the final period as income. Under the "percentage-of-completion" method, actual costs are reported on the income statement plus a proportion of all project revenues (or billings) equal to the proportion of work completed during the period. The proportion of work completed is computed as the ratio of costs incurred to date and the total estimated cost of the project. Thus, if twenty percent of a project was completed in a particular period at a direct cost of $180,000 and on a project with expected revenues of $1,000,000, then the contract revenues earned would be calculated as $1,000,000(0.2) = $200,000. This figure represents a profit and contribution to overhead of $200,000 - $180,000 = $20,000 for the period. Note that billings and actual receipts might be in excess or less than the calculated revenues of $200,000. On the balance sheet of an organization using the percentage-of-completion method, an asset is usually reported to reflect billings and the estimated or calculated earnings in excess of actual billings. As another example of the difference in the "percentage-of-completion" and the "completed-contract" methods, consider a three year project to construct a plant with the following cash flow for a contractor:
The supervising architect determines that 60% of the facility is complete in year 1 and 75% in year 2. Under the "percentage-of-completion" method, the net income in year 1 is $780,000 (60% of $1,300,000) less the $700,000 in expenses or $80,000. Under the "completed-contract" method, the entire profit of $100,000 would be reported in year 3. The "percentage-of-completion" method of reporting period earnings has the advantage of representing the actual estimated earnings in each period. As a result, the income stream and resulting profits are less susceptible to precipitate swings on the completion of a project as can occur with the "completed contract method" of calculating income. However, the "percentage-of-completion" has the disadvantage of relying upon estimates which can be manipulated to obscure the actual position of a company or which are difficult to reproduce by outside observers. There are also subtleties such as the deferral of all calculated income from a project until a minimum threshold of the project is completed. As a result, interpretation of the income statement and balance sheet of a private organization is not always straightforward. Finally, there are tax disadvantages from using the "percentage-of-completion" method since corporate taxes on expected profits may become due during the project rather than being deferred until the project completion. As an example of tax implications of the two reporting methods, a study of forty-seven construction firms conducted by the General Accounting Office found that $280 million in taxes were deferred from 1980 to 1984 through use of the "completed-contract" method. [6] It should be apparent that the "percentage-of-completion" accounting provides only a rough estimate of the actual profit or status of a project. Also, the "completed contract" method of accounting is entirely retrospective and provides no guidance for management. This is only one example of the types of allocations that are introduced to correspond to generally accepted accounting practices, yet may not further the cause of good project management. Another common example is the use of equipment depreciation schedules to allocate equipment purchase costs. Allocations of costs or revenues to particular periods within a project may cause severe changes in particular indicators, but have no real meaning for good management or profit over the entire course of a project. As Johnson and Kaplan argue: [7]
As a result, complementary procedures to those used in traditional financial accounting are required to accomplish effective project control, as described in the preceding and following sections. While financial statements provide consistent and essential information on the condition of an entire organization, they need considerable interpretation and supplementation to be useful for project management. Example 12-5: Calculating net profit As an example of the calculation of net profit, suppose that a company began six jobs in a year, completing three jobs and having three jobs still underway at the end of the year. Details of the six jobs are shown in Table 12-7. What would be the company's net profit under, first, the "percentage-of-completion" and, second, the "completed contract method" accounting conventions?Back to top 12.5 Control of Project Cash FlowsSection 12.3 described the development of information for the control of project costs with respect to the various functional activities appearing in the project budget. Project managers also are involved with assessment of the overall status of the project, including the status of activities, financing, payments and receipts. These various items comprise the project and financing cash flows described in earlier chapters. These components include costs incurred (as described above), billings and receipts for billings to owners (for contractors), payable amounts to suppliers and contractors, financing plan cash flows (for bonds or other financial instruments), etc. As an example of cash flow control, consider the report shown in Table 12-8. In this case, costs are not divided into functional categories as in Table 12-4, such as labor, material, or equipment. Table 12-8 represents a summary of the project status as viewed from different components of the accounting system. Thus, the aggregation of different kinds of cost exposure or cost commitment shown in Table 12-0 has not been performed. The elements in Table 12-8 include:
Each of the rows shown in Table 12-8 would be derived from different sets of financial accounts. Additional reports could be prepared on the financing cash flows for bonds or interest charges in an overdraft account.
The overall status of the project requires synthesizing the different pieces of information summarized in Table 12-8. Each of the different accounting systems contributing to this table provides a different view of the status of the project. In this example, the budget information indicates that costs are higher than expected, which could be troubling. However, a profit is still expected for the project. A substantial amount of money is due from the owner, and this could turn out to be a problem if the owner continues to lag in payment. Finally, the positive cash position for the project is highly desirable since financing charges can be avoided. The job status reports illustrated in this and the previous sections provide a primary tool for project cost control. Different reports with varying amounts of detail and item reports would be prepared for different individuals involved in a project. Reports to upper management would be summaries, reports to particular staff individuals would emphasize their responsibilities (eg. purchasing, payroll, etc.), and detailed reports would be provided to the individual project managers. Coupled with scheduling reports described in Chapter 10, these reports provide a snapshot view of how a project is doing. Of course, these schedule and cost reports would have to be tempered by the actual accomplishments and problems occurring in the field. For example, if work already completed is of sub-standard quality, these reports would not reveal such a problem. Even though the reports indicated a project on time and on budget, the possibility of re-work or inadequate facility performance due to quality problems would quickly reverse that rosy situation. Back to top12.6 Schedule ControlIn addition to cost control, project managers must also give considerable attention to monitoring schedules. Construction typically involves a deadline for work completion, so contractual agreements will force attention to schedules. More generally, delays in construction represent additional costs due to late facility occupancy or other factors. Just as costs incurred are compared to budgeted costs, actual activity durations may be compared to expected durations. In this process, forecasting the time to complete particular activities may be required. The methods used for forecasting completion times of activities are directly analogous to those used for cost forecasting. For example, a typical estimating formula might be:
where Df is the forecast duration, W is the amount of work, and ht is the observed productivity to time t. As with cost control, it is important to devise efficient and cost effective methods for gathering information on actual project accomplishments. Generally, observations of work completed are made by inspectors and project managers and then work completed is estimated as described in Section 12.3. Once estimates of work complete and time expended on particular activities is available, deviations from the original duration estimate can be estimated. The calculations for making duration estimates are quite similar to those used in making cost estimates in Section 12.3. For example, Figure 12-2 shows the originally scheduled project progress versus the actual progress on a project. This figure is constructed by summing up the percentage of each activity which is complete at different points in time; this summation can be weighted by the magnitude of effort associated with each activity. In Figure 12-2, the project was ahead of the original schedule for a period including point A, but is now late at point B by an amount equal to the horizontal distance between the planned progress and the actual progress observed to date. 
Figure 12-2 Illustration of Planned versus Actual Progress over Time on a Project Schedule adherence and the current status of a project can also be represented on geometric models of a facility. For example, an animation of the construction sequence can be shown on a computer screen, with different colors or other coding scheme indicating the type of activity underway on each component of the facility. Deviations from the planned schedule can also be portrayed by color coding. The result is a mechanism to both indicate work in progress and schedule adherence specific to individual components in the facility. In evaluating schedule progress, it is important to bear in mind that some activities possess float or scheduling leeway, whereas delays in activities on the critical path will cause project delays. In particular, the delay in planned progress at time t may be soaked up in activities' float (thereby causing no overall delay in the project completion) or may cause a project delay. As a result of this ambiguity, it is preferable to update the project schedule to devise an accurate protrayal of the schedule adherence. After applying a scheduling algorithm, a new project schedule can be obtained. For cash flow planning purposes, a graph or report similar to that shown in Figure 12-3 can be constructed to compare actual expenditures to planned expenditures at any time. This process of re-scheduling to indicate the schedule adherence is only one of many instances in which schedule and budget updating may be appropriate, as discussed in the next section. 
Figure 12-3 Illustration of Planned versus Actual Expenditures on a Project Back to top 12.7 Schedule and Budget UpdatesScheduling and project planning is an activity that continues throughout the lifetime of a project. As changes or discrepancies between the plan and the realization occur, the project schedule and cost estimates should be modified and new schedules devised. Too often, the schedule is devised once by a planner in the central office, and then revisions or modifications are done incompletely or only sporadically. The result is the lack of effective project monitoring and the possibility of eventual chaos on the project site. On "fast track" projects, initial construction activities are begun even before the facility design is finalized. In this case, special attention must be placed on the coordinated scheduling of design and construction activities. Even in projects for which the design is finalized before construction begins, change orders representing changes in the "final" design are often issued to incorporate changes desired by the owner. Periodic updating of future activity durations and budgets is especially important to avoid excessive optimism in projects experiencing problems. If one type of activity experiences delays on a project, then related activities are also likely to be delayed unless managerial changes are made. Construction projects normally involve numerous activities which are closely related due to the use of similar materials, equipment, workers or site characteristics. Expected cost changes should also be propagated thoughout a project plan. In essence, duration and cost estimates for future activities should be revised in light of the actual experience on the job. Without this updating, project schedules slip more and more as time progresses. To perform this type of updating, project managers need access to original estimates and estimating assumptions. Unfortunately, most project cost control and scheduling systems do not provide many aids for such updating. What is required is a means of identifying discrepancies, diagnosing the cause, forecasting the effect, and propagating this effect to all related activities. While these steps can be undertaken manually, computers aids to support interactive updating or even automatic updating would be helpful. [8] Beyond the direct updating of activity durations and cost estimates, project managers should have mechanisms available for evaluating any type of schedule change. Updating activity duration estimations, changing scheduled start times, modifying the estimates of resources required for each activity, and even changing the project network logic (by inserting new activities or other changes) should all be easily accomplished. In effect, scheduling aids should be directly available to project managers. [9] Fortunately, local computers are commonly available on site for this purpose. Example 12-6: Schedule Updates in a Small Project As an example of the type of changes that might be required, consider the nine activity project described in Section 10.3 and appearing in Figure 12-4. Also, suppose that the project is four days underway, with the current activity schedule and progress as shown in Figure 12-5. A few problems or changes that might be encountered include the following:Back to top 12.8 Relating Cost and Schedule InformationThe previous sections focused upon the identification of the budgetary and schedule status of projects. Actual projects involve a complex inter-relationship between time and cost. As projects proceed, delays influence costs and budgetary problems may in turn require adjustments to activity schedules. Trade-offs between time and costs were discussed in Section 10.9 in the context of project planning in which additional resources applied to a project activity might result in a shorter duration but higher costs. Unanticipated events might result in increases in both time and cost to complete an activity. For example, excavation problems may easily lead to much lower than anticipated productivity on activities requiring digging. While project managers implicitly recognize the inter-play between time and cost on projects, it is rare to find effective project control systems which include both elements. Usually, project costs and schedules are recorded and reported by separate application programs. Project managers must then perform the tedious task of relating the two sets of information. The difficulty of integrating schedule and cost information stems primarily from the level of detail required for effective integration. Usually, a single project activity will involve numerous cost account categories. For example, an activity for the preparation of a foundation would involve laborers, cement workers, concrete forms, concrete, reinforcement, transportation of materials and other resources. Even a more disaggregated activity definition such as erection of foundation forms would involve numerous resources such as forms, nails, carpenters, laborers, and material transportation. Again, different cost accounts would normally be used to record these various resources. Similarly, numerous activities might involve expenses associated with particular cost accounts. For example, a particular material such as standard piping might be used in numerous different schedule activities. To integrate cost and schedule information, the disaggregated charges for specific activities and specific cost accounts must be the basis of analysis. A straightforward means of relating time and cost information is to define individual work elements representing the resources in a particular cost category associated with a particular project activity. Work elements would represent an element in a two-dimensional matrix of activities and cost accounts as illustrated in Figure 12-6. A numbering or identifying system for work elements would include both the relevant cost account and the associated activity. In some cases, it might also be desirable to identify work elements by the responsible organization or individual. In this case, a three dimensional representation of work elements is required, with the third dimension corresponding to responsible individuals. [10] More generally, modern computerized databases can accomadate a flexible structure of data representation to support aggregation with respect to numerous different perspectives; this type of system will be discussed in Chapter 14. With this organization of information, a number of management reports or views could be generated. In particular, the costs associated with specific activities could be obtained as the sum of the work elements appearing in any row in Figure 12-6. These costs could be used to evaluate alternate technologies to accomplish particular activities or to derive the expected project cash flow over time as the schedule changes. From a management perspective, problems developing from particular activities could be rapidly identified since costs would be accumulated at such a disaggregated level. As a result, project control becomes at once more precise and detailed. 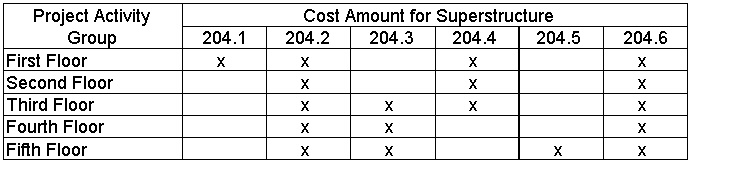
Figure 12-6 Illustration of a Cost Account and Project Activity Matrix Unfortunately, the development and maintenance of a work element database can represent a large data collection and organization effort. As noted earlier, four hundred separate cost accounts and four hundred activities would not be unusual for a construction project. The result would be up to 400x400 = 160,000 separate work elements. Of course, not all activities involve each cost account. However, even a density of two percent (so that each activity would have eight cost accounts and each account would have eight associated activities on the average) would involve nearly thirteen thousand work elements. Initially preparing this database represents a considerable burden, but it is also the case that project bookkeepers must record project events within each of these various work elements. Implementations of the "work element" project control systems have typically fondered on the burden of data collection, storage and book-keeping. Until data collection is better automated, the use of work elements to control activities in large projects is likely to be difficult to implement. However, certain segments of project activities can profit tremendously from this type of organization. In particular, material requirements can be tracked in this fashion. Materials involve only a subset of all cost accounts and project activities, so the burden of data collection and control is much smaller than for an entire system. Moreover, the benefits from integration of schedule and cost information are particularly noticeable in materials control since delivery schedules are directly affected and bulk order discounts might be identified. Consequently, materials control systems can reasonably encompass a "work element" accounting system. In the absence of a work element accounting system, costs associated with particular activities are usually estimated by summing expenses in all cost accounts directly related to an activity plus a proportion of expenses in cost accounts used jointly by two or more activities. The basis of cost allocation would typically be the level of effort or resource required by the different activities. For example, costs associated with supervision might be allocated to different concreting activities on the basis of the amount of work (measured in cubic yards of concrete) in the different activities. With these allocations, cost estimates for particular work activities can be obtained. Back to top12.9 References
12.10 Problems
12.11 Footnotes1. Cited in Zoll, Peter F., "Database Structures for Project Management," Proceedings of the Seventh Conference on Electronic Computation, ASCE, 1979. Back 2. Thomas Gibb reports a median number of 400 cost accounts for a two-million dollar projects in a sample of 30 contractors in 1975. See T.W. Gibb, Jr., "Building Construction in Southeastern United States," School of Civil Engineering, Georgia Institute of Technology, 1975, reported in D.W. Halpin, Financial and Cost Concepts for Construction Management, John Wiley and Sons, 1985. Back 3. This illustrative set of accounts was adapted from an ASCE Manual of Practice: Construction Cost Control, Task Committee on Revision of Construction Cost Control Manual, ASCE, New York, 1985. Back 4. For a fuller exposition of this point, see W.H. Lucas and T.L. Morrison, "Management Accounting for Construction Contracts," Management Accounting, 1981, pp. 59-65. Back 5. For a description of these methods and examples as used by a sample of construction companies, see L.S. Riggs, Cost and Schedule Control in Industrial Construction, Report to The Construction Industry Institute, Dec. 1986. Back 6. As reported in the Wall Street Journal, Feb. 19, 1986, pg. A1, c. 4. Back 7. H.T. Johnson and R.S. Kaplan, Relevance Lost, The Rise and Fall of Management Accounting, Harvard Business School Press, pg. 1, 1987. Back 8. One experimental program directed at this problem is a knowledge based expert system described in R.E. Levitt and J.C. Kunz, "Using Knowledge of Construction and Project Management for Automated Schedule Updating," Project Management Journal, Vol. 16, 1985, pp. 57-76. Back 9. For an example of a prototype interactive project management environment that includes graphical displays and scheduling algorithms, see R. Kromer, "Interactive Activity Network Analysis Using a Personal Computer," Unpublished MS Thesis, Department of Civil Engineering, Carnegie-Mellon University, Pittsburgh, PA, 1984. Back 10. A three dimensional work element definition was
proposed by J.M. Neil, "A System for Integrated Project Management," Proceedings
of the Conference on Current Practice in Cost Estimating and Cost Control,
ASCE, Austin, Texas, 138-146, April 1983. Back
|
||||||||||||||||||||||||||||||||||||||||||||||||||||||||||||||||||||||||||||||||||||||||||||||||||||||||||||||||||||||||||||||||||||||||||||||||||||||||||||||||||||||||||||||||||||||||||||||||||||||||||||||||||||||||||||||
 |